
Market scanning · monitoring · chart analysis
Scan the market. Find notable moves. See the context on the chart.
Filter hundreds of Futures symbols; find possible reversals, extreme moves and 4H consolidations. Build your own analysis workflow with favorites, My Notes, alerts, notifications and multi-timeframe charts.
Market and market-cap filters
4H consolidation and extreme-move analysis
S1 / R1 alert tracking
My Notes + multi-timeframe chart
Modules
One analysis workflow from candidate discovery to chart review
Each module views the market from a different angle. Favorites, My Notes, alerts and charts work together across screens.
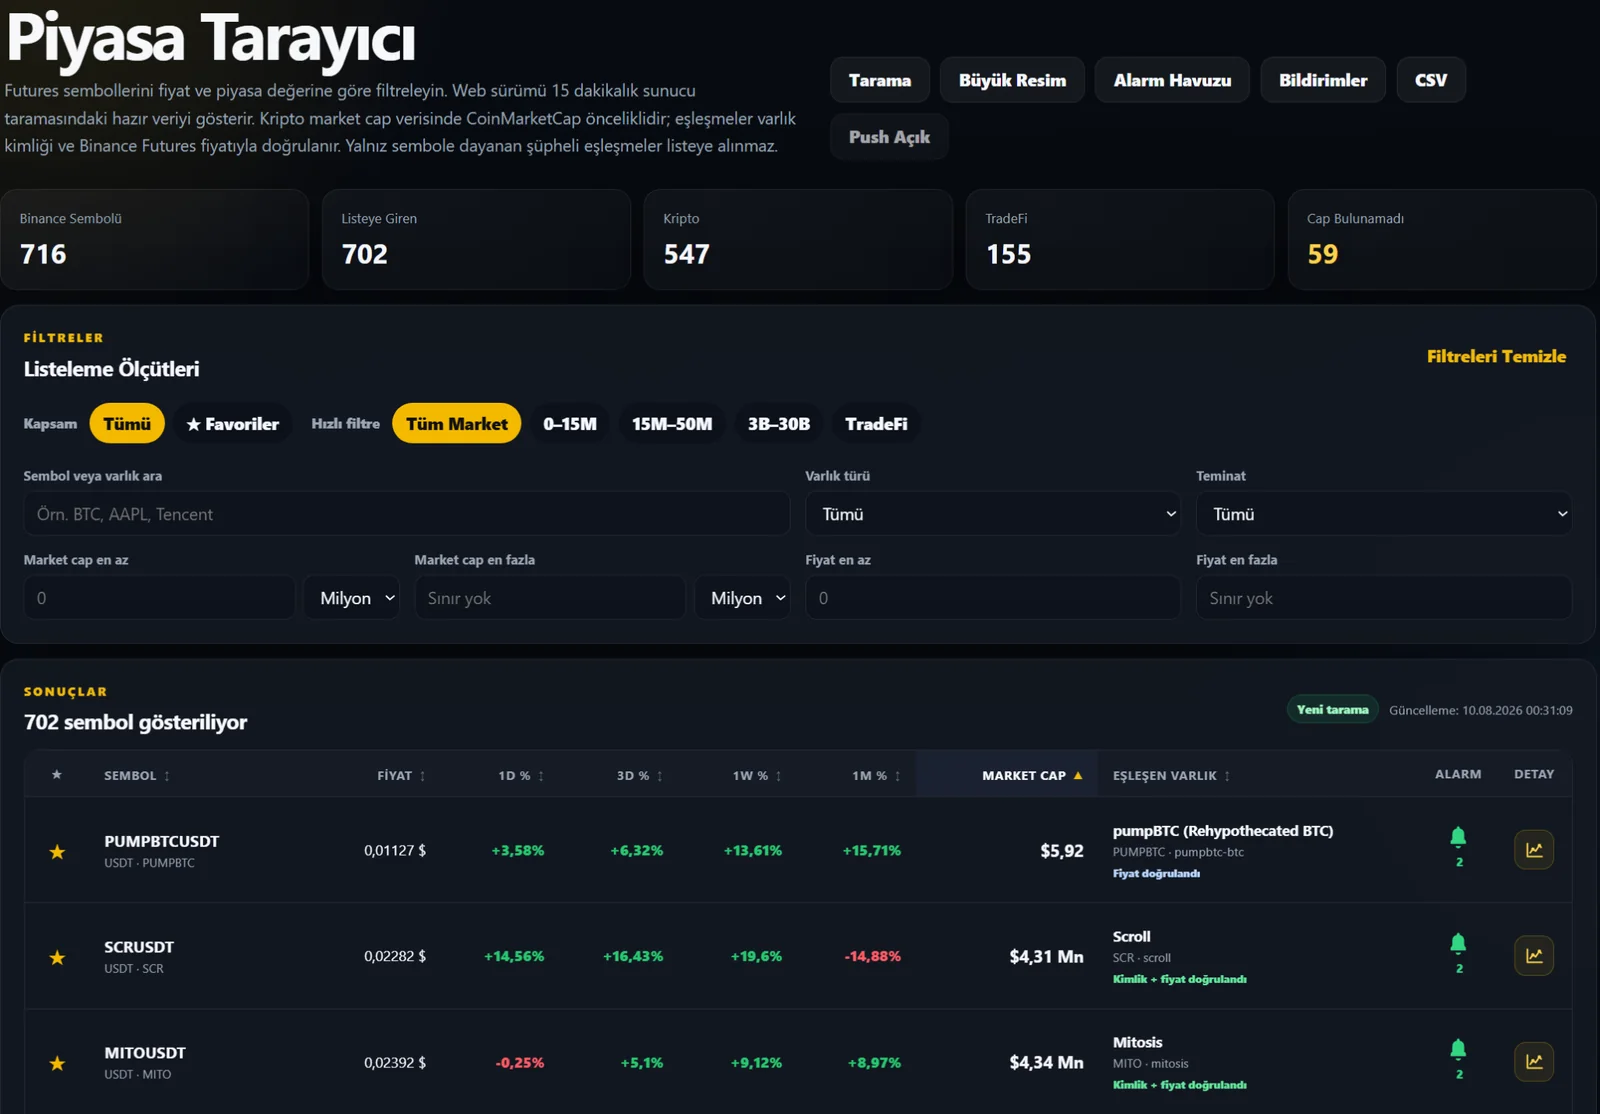
⌕ Market Scan
Price, market cap, performance and asset-type filters; four favorite levels and My Notes filtering.
View details →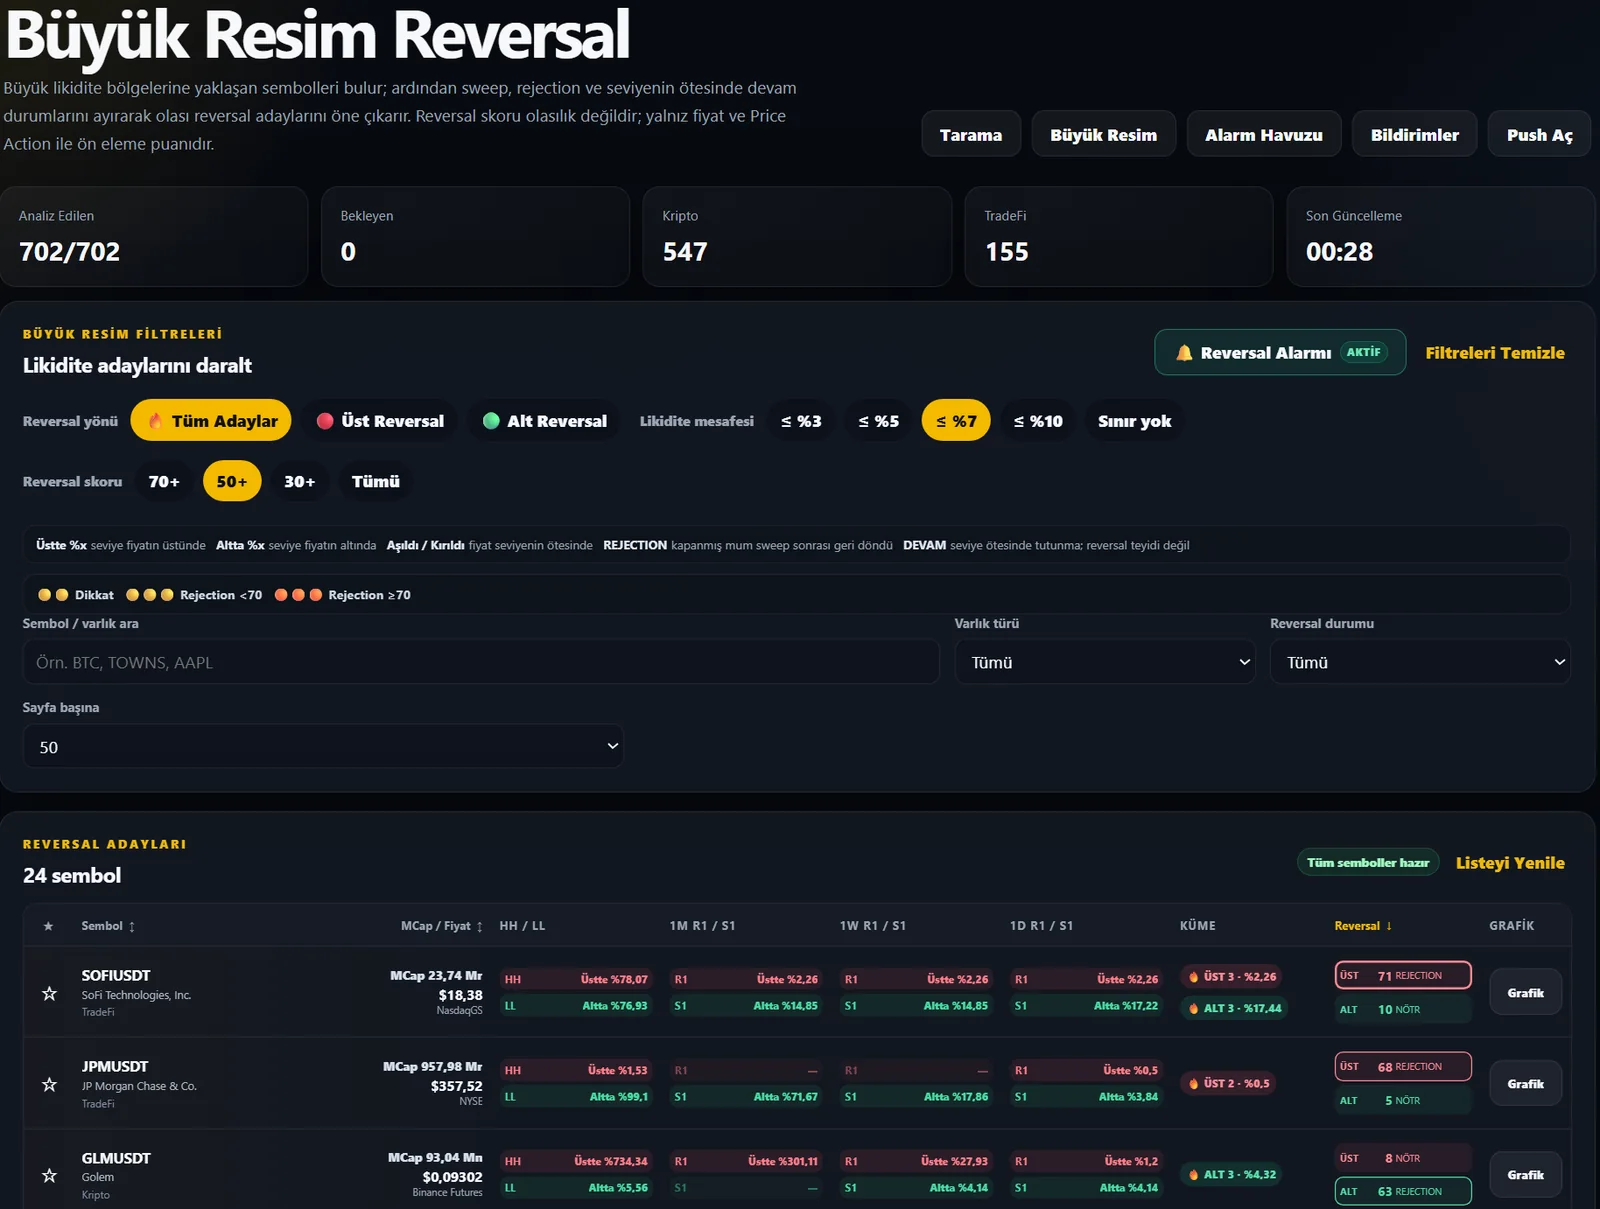
↺ Possible Reversals
Compare sweep, rejection and continuation behavior around liquidity regions.
View details →Extreme Moves
Compare the main move, counter move, retraced and remaining range on one screen.
View details →4H Consolidation
Surface strong consolidation candidates using range, ATR contraction, volume and directionlessness.
View details →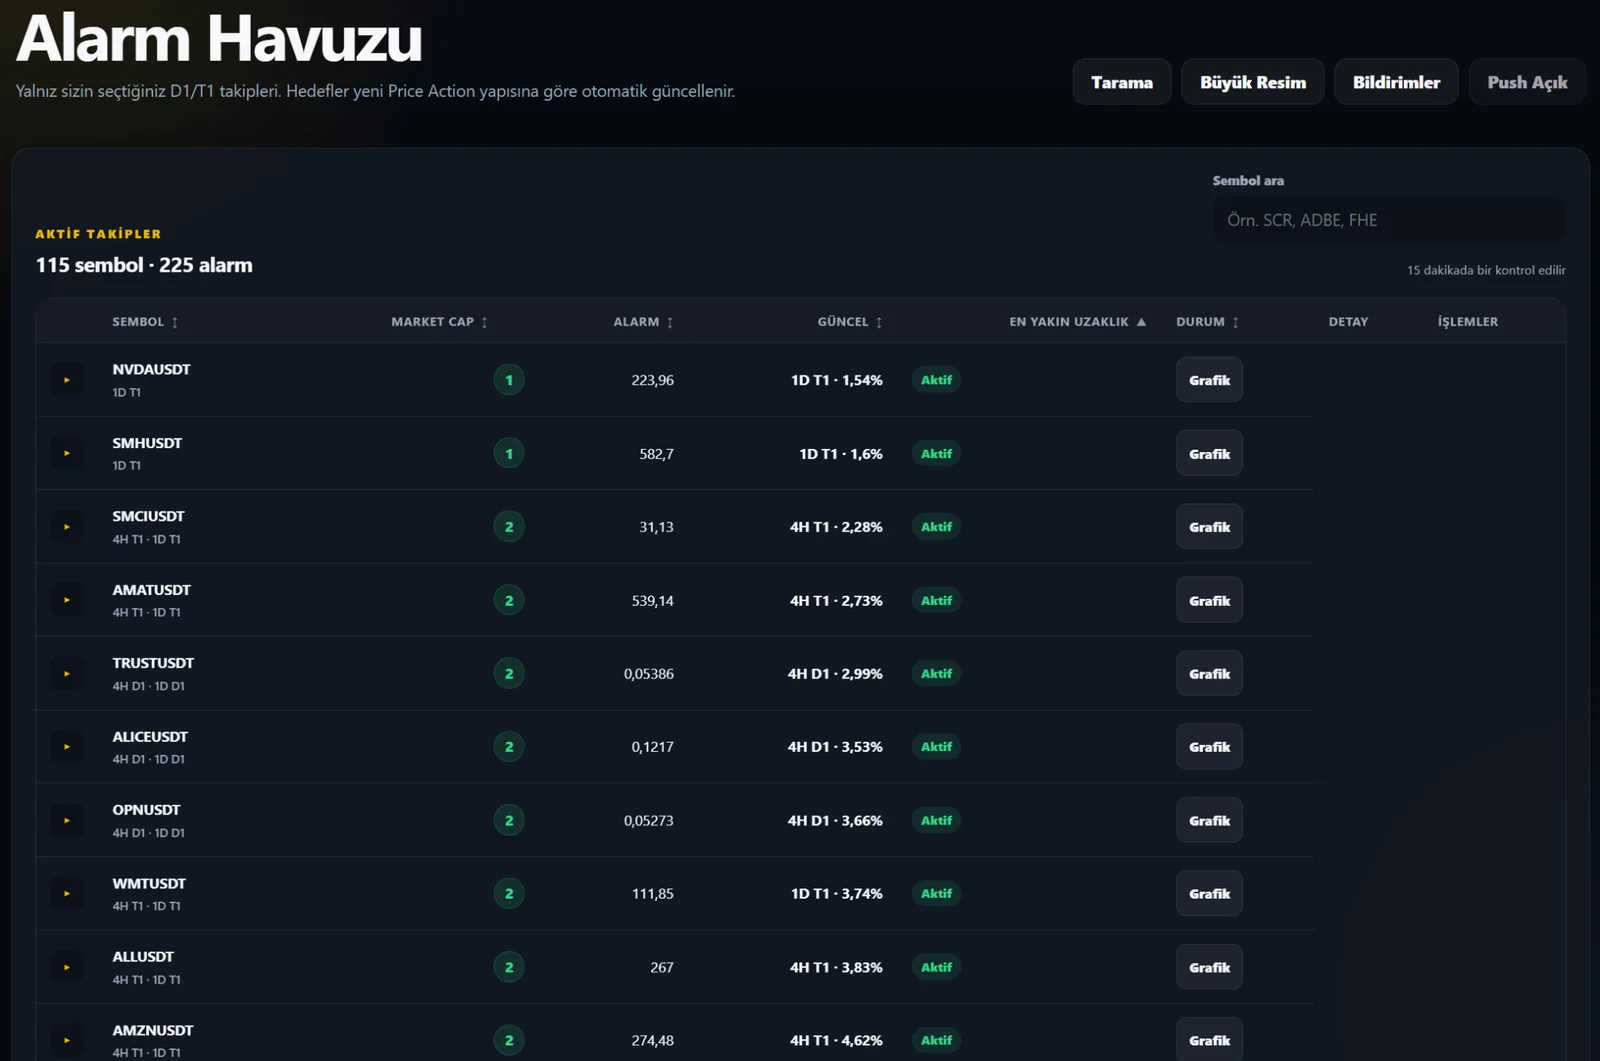
♟ My Alerts
Track approach, touch and structure changes for selected 4H and 1D S1/R1 levels.
View details →Daily Sudden Move Alert
Track sudden rises and declines from the daily open using your own thresholds.
View details →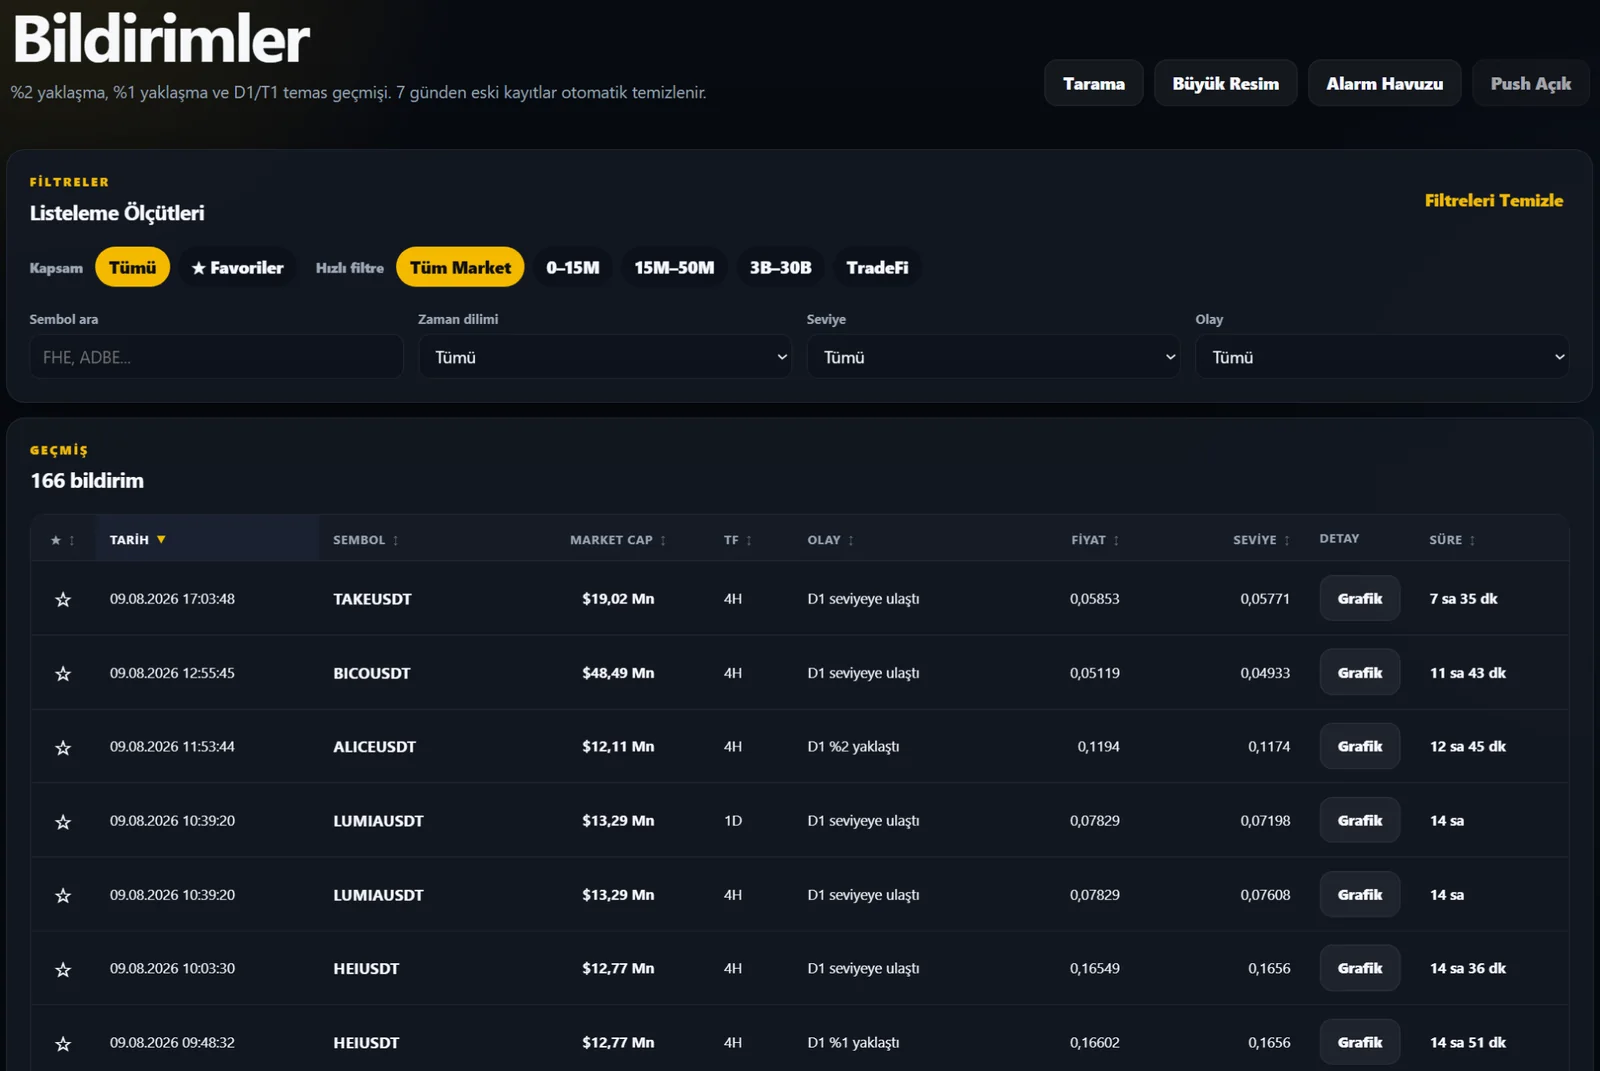
▤ My Notifications
See S1/R1 and sudden-move events in one history and filter them by symbol, event and personal monitoring.
View details →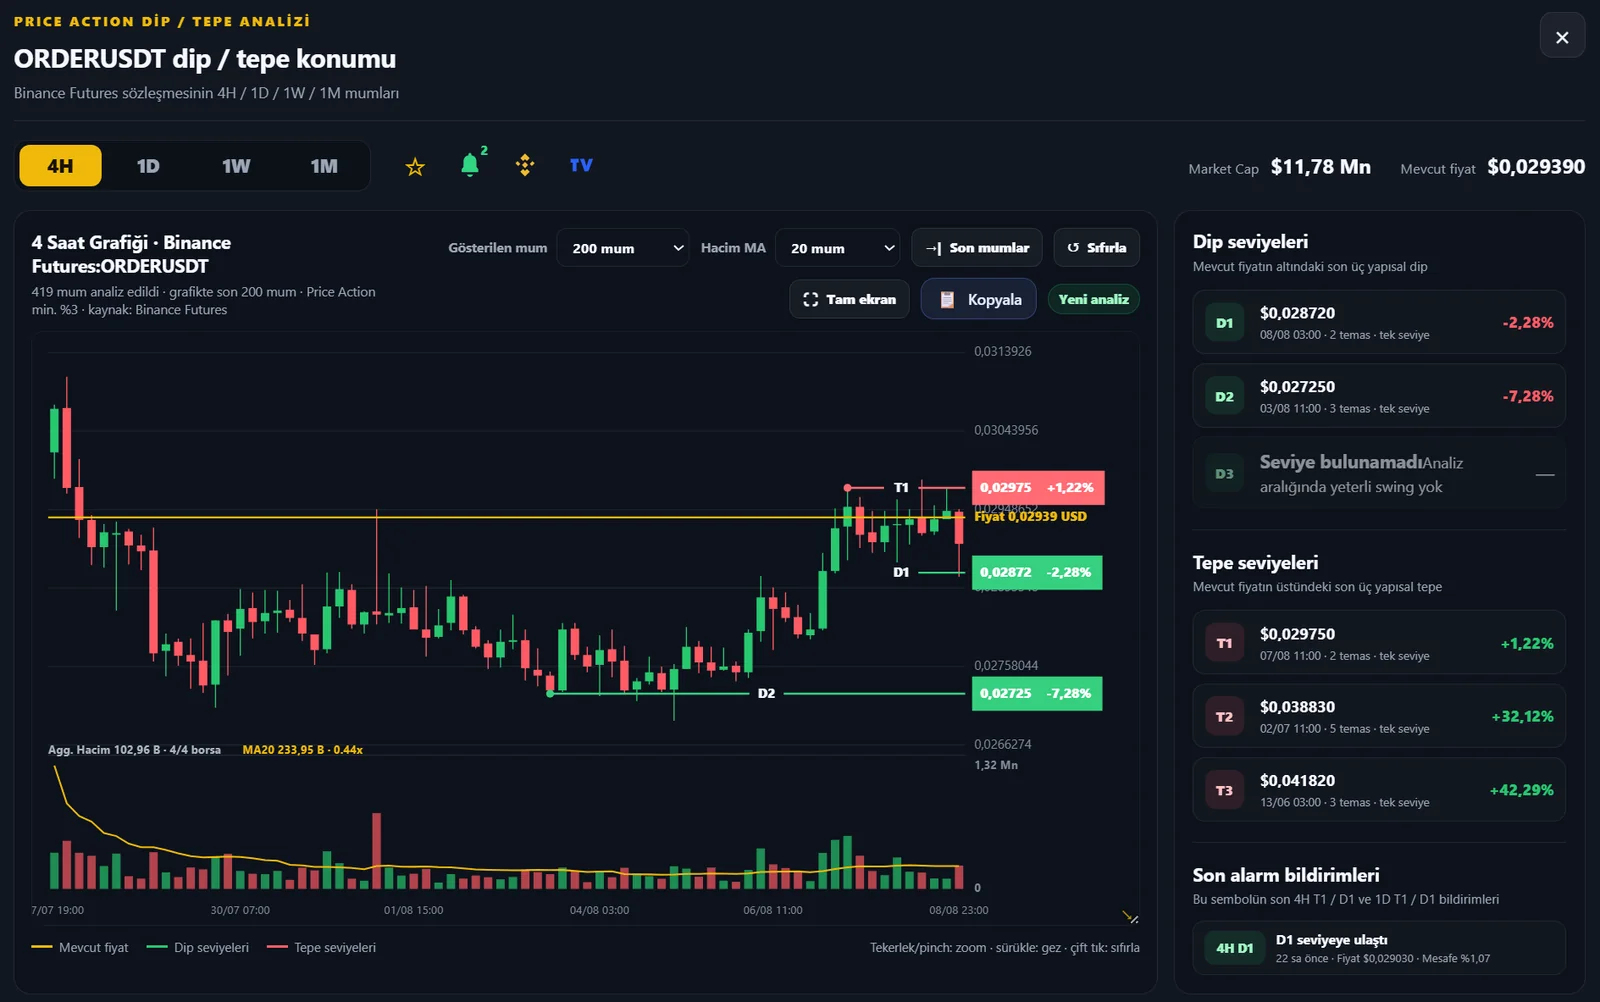
▥ Chart
Bring 4H / 1D / 1W / 1M structure, S1/R1 levels, volume and personal monitoring tools together on one screen.
Explore chart →Daily workflow
Scan → prioritize → take notes → set alerts → review on chart
Narrow the market
Use filters and sorting to create a focused group from hundreds of symbols.
Set priorities
Use Watch, Important, VIP and Close Watch levels to organize symbols by personal priority.
Add your note
Keep observations or plans in the symbol-specific My Notes area.
Set alerts
Use alerts to revisit a symbol when S1/R1 levels or sudden-move conditions occur.
See context on the chart
Complete your analysis by reviewing multiple timeframes, structural levels and volume together.